
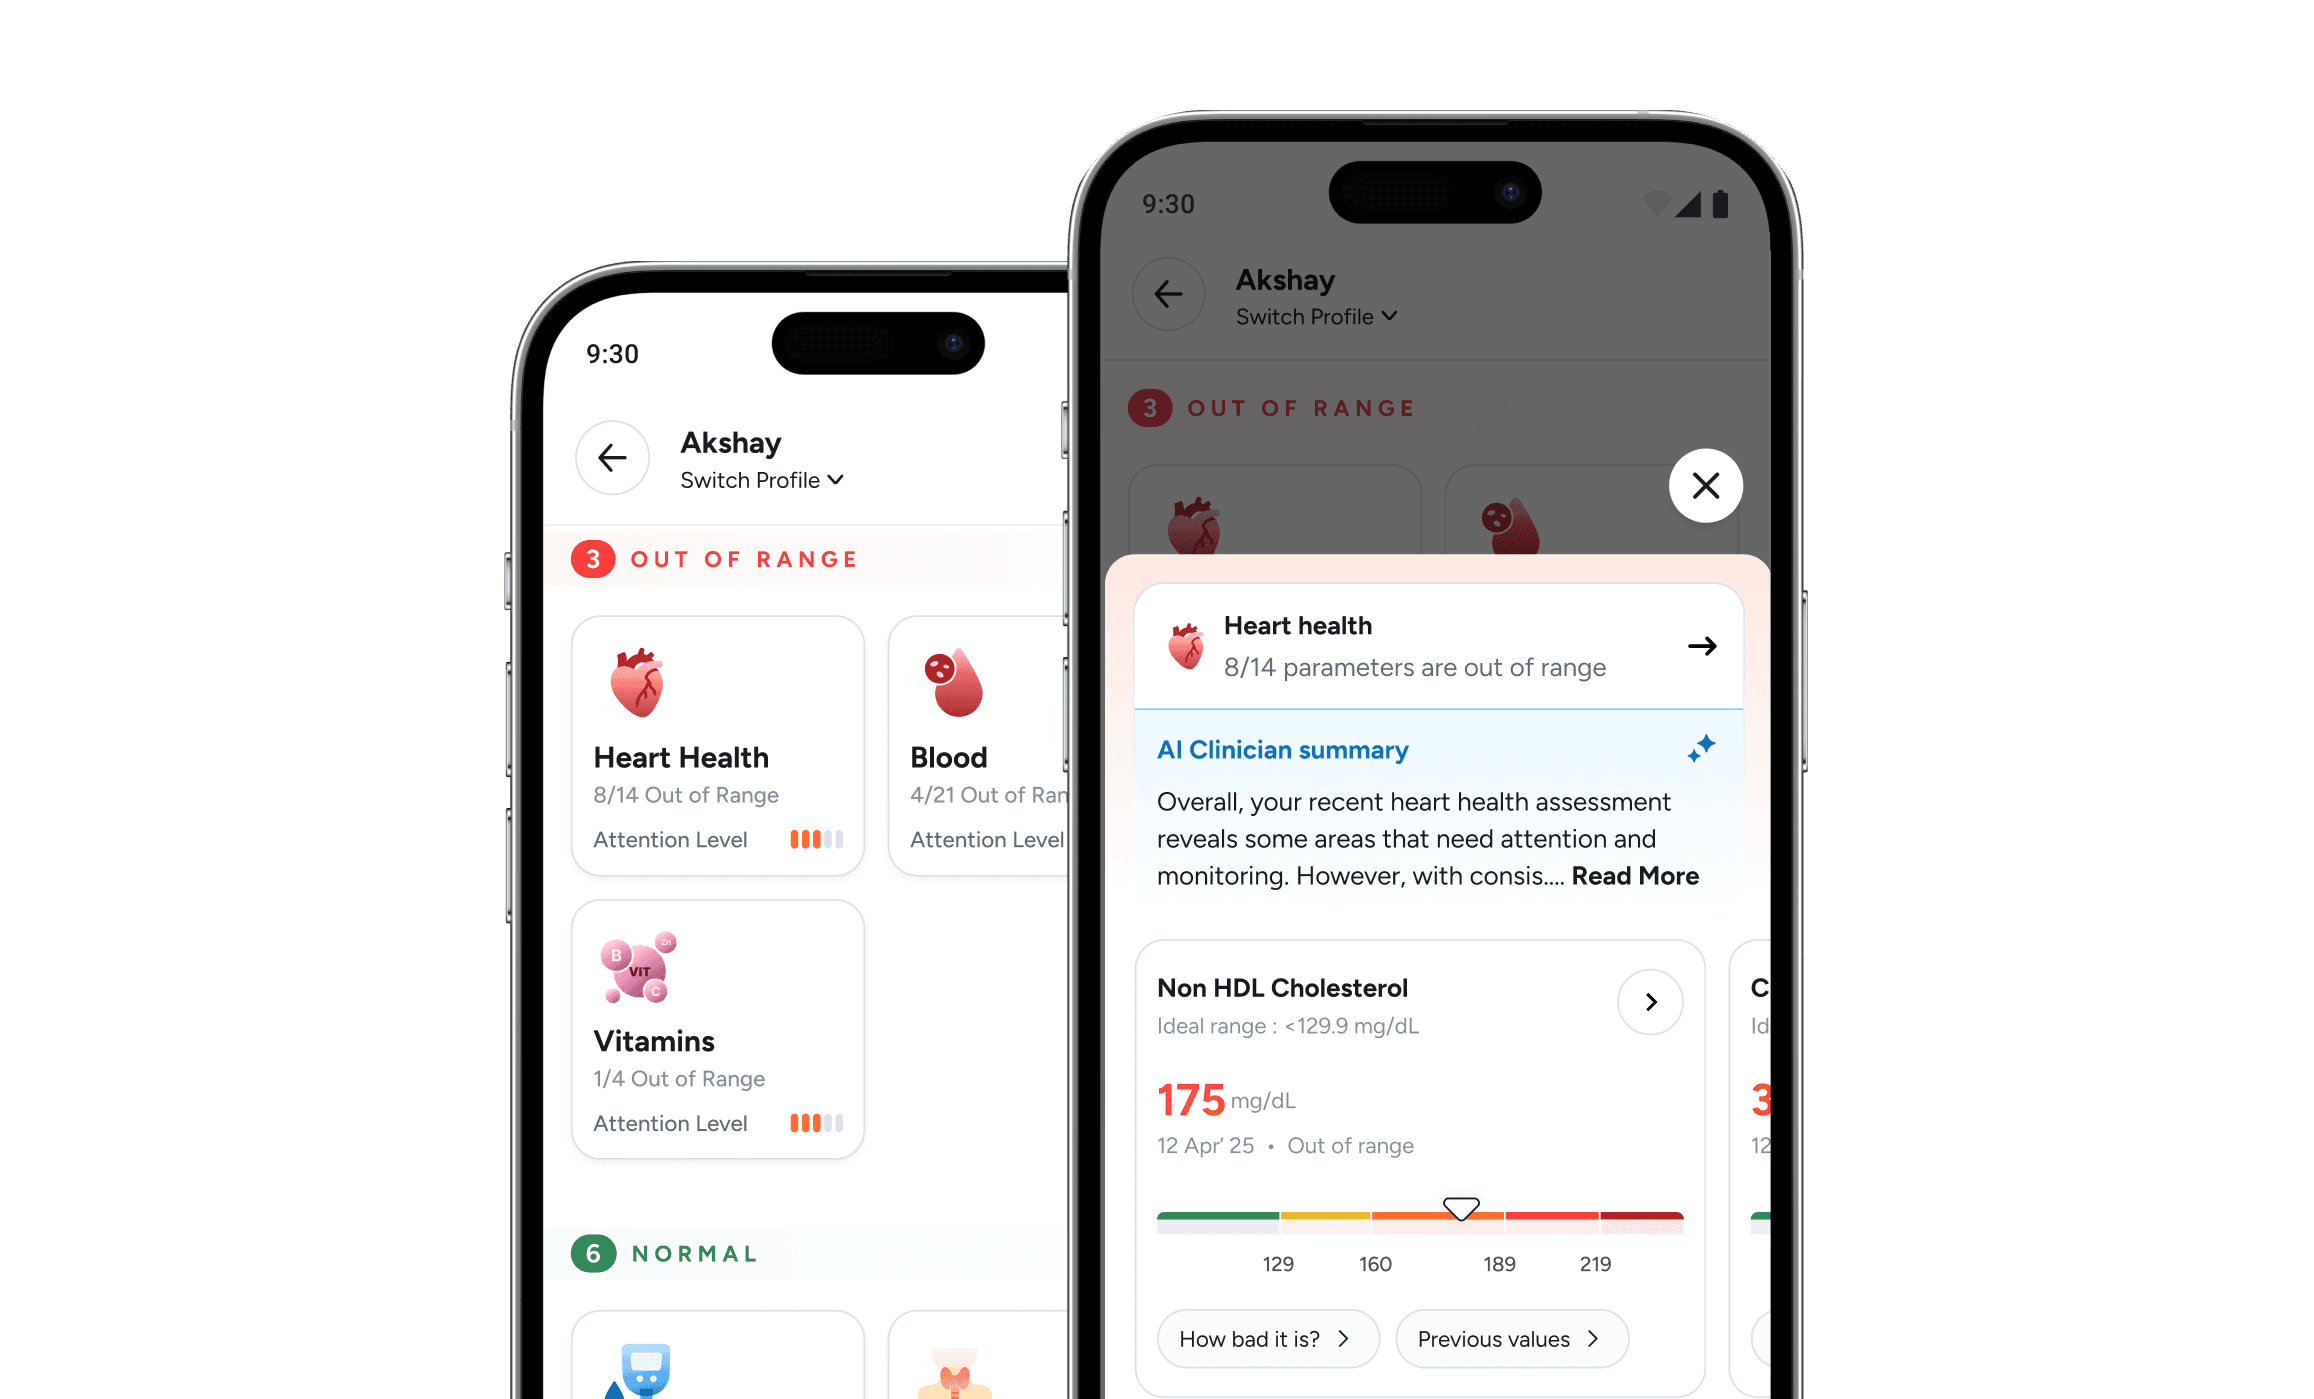

Turning a lab report into something a person can actually use
Diagnostics • consumer app
Diagnostics • consumer app
00
Context
00
Tata 1mg processes millions of lab reports every year. The flow worked fine on paper: user books a test, lab sends results, user gets a PDF. Simple
Tata 1mg processes millions of lab reports every year. The flow worked fine on paper: user books a test, lab sends results, user gets a PDF. Simple
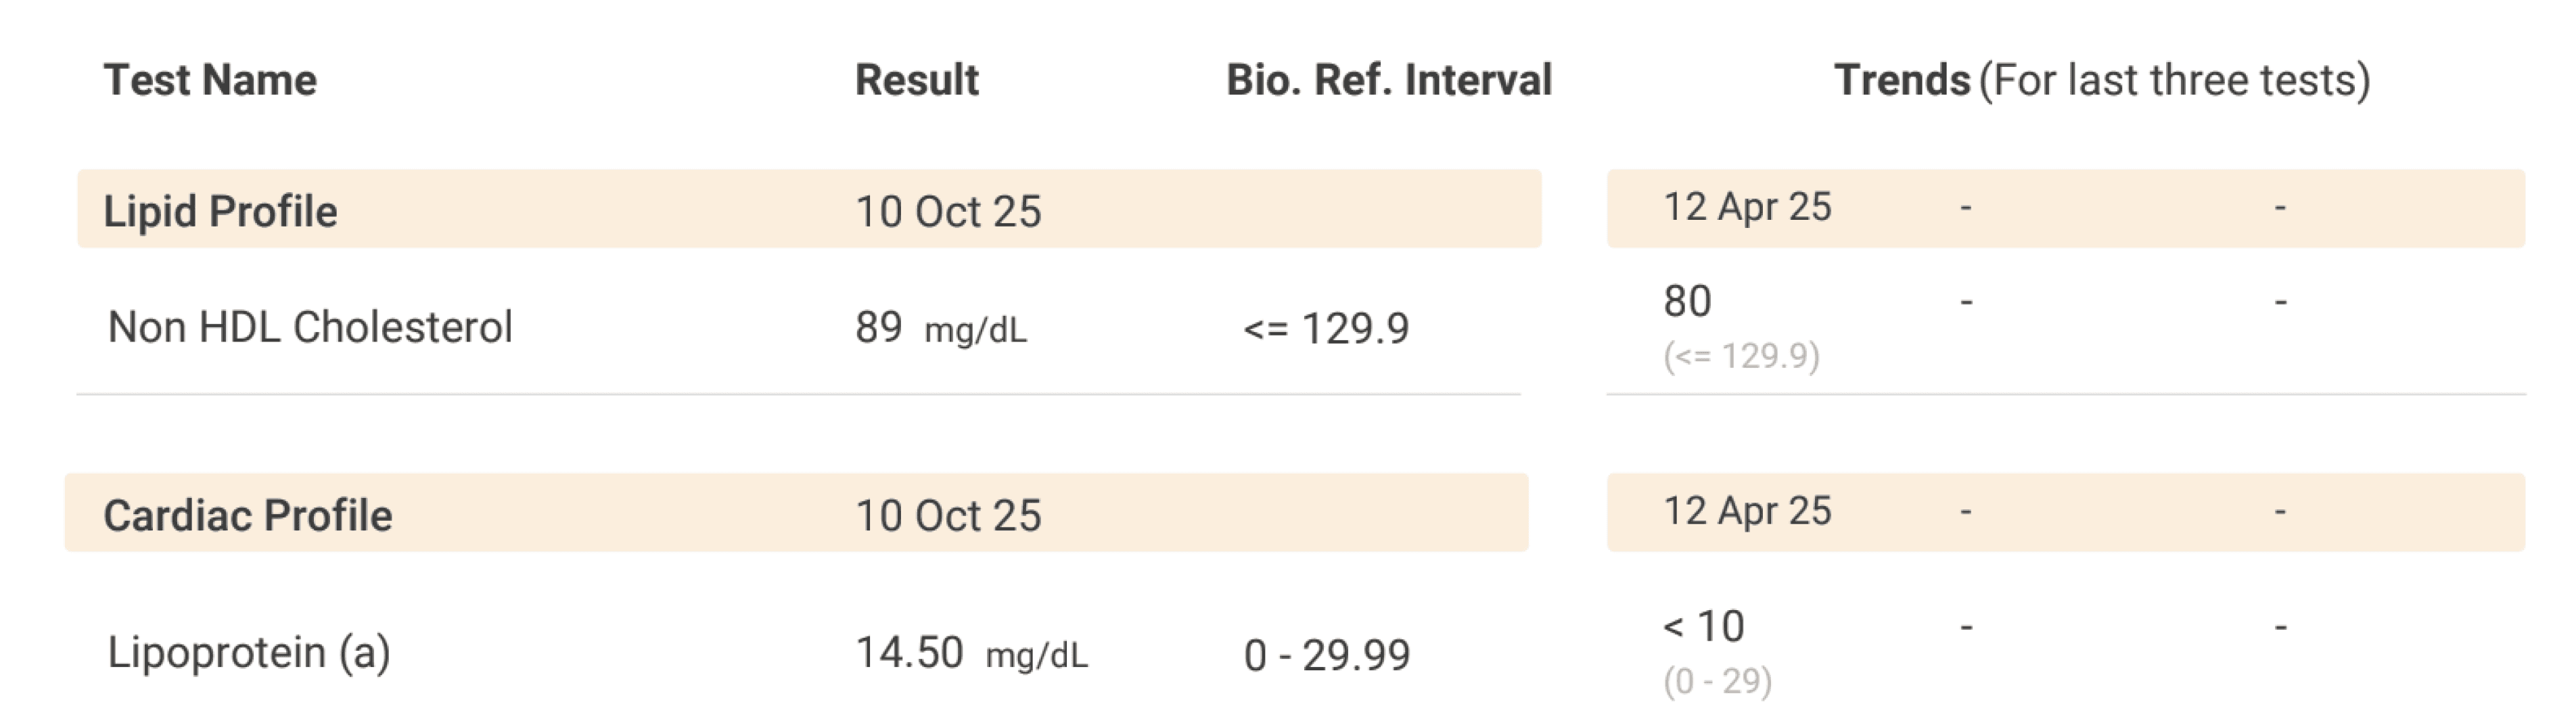
The problem was what happened after. Users opened a document designed for a pathologist
The problem was what happened after. Users opened a document designed for a pathologist
Dense reference tables
Clinical abbreviations
Rows of numbers with no narrative.
Dense reference tables
Clinical abbreviations
Rows of numbers with no narrative.
They couldn't parse it. They didn't know what mattered, what to worry about, or what to do next. The idea is to bridge the gap between clinical data and human understanding by converting medical report into meaningful, contextual and actionable insights that empower users to better understanding and manage their health
They couldn't parse it. They didn't know what mattered, what to worry about, or what to do next. The idea is to bridge the gap between clinical data and human understanding by converting medical report into meaningful, contextual and actionable insights that empower users to better understanding and manage their health
Clarity
The PDF wasn't a product failure. It was a category error — we were delivering data when people needed meaning.
The PDF wasn't a product failure. It was a category error — we were delivering data when people needed meaning.
01
The Problem
01
When a patient opens their lab report, they're trying to answer one question:
When a patient opens their lab report, they're trying to answer one question:
"Am I okay?"
"Am I okay?"

The old experience couldn't answer that. Users would scan for anything flagged High or Low, get anxious, Google the parameter, read a Wikipedia article that scared them more, and close the app no better informed than when they started.
The old experience couldn't answer that. Users would scan for anything flagged High or Low, get anxious, Google the parameter, read a Wikipedia article that scared them more, and close the app no better informed than when they started.
Or worse they'd see nothing highlighted, assume everything was fine, and dismiss genuinely concerning values because they didn't know what normal actually meant.
Or worse they'd see nothing highlighted, assume everything was fine, and dismiss genuinely concerning values because they didn't know what normal actually meant.

Medical reports are designed for the clinician who ordered the test. Every design choice from layout to terminology optimises for clinical precision over human comprehension. The patient was an afterthought.
Medical reports are designed for the clinician who ordered the test. Every design choice from layout to terminology optimises for clinical precision over human comprehension. The patient was an afterthought.
02
What Users Told Us
02
We ran few interviews across cities with users who had received a lab report in the last 6 months. We recruited across literacy levels, age groups, and health literacy because the product had to work for all of them.
Three mental models came up in nearly every session:
The Report Card Model
"Tell me if I passed or failed." Users wanted a verdict, not a dataset. They weren't interested in individual numbers they wanted to know their overall status.


The Worry Model
"I'm looking for what's wrong." Most users opened reports already anxious. Anything flagged amplified that anxiety. Anything unflagged was assumed to be fine even when it wasn't.
The Delegation Model
"My doctor will explain it later." Many users skimmed the PDF and set it aside. The report added nothing to their understanding it was just an obligation to hand off.

Users didn't have a data problem. They had a translation problem. The report was delivering information, but no meaning. Our job was to close that gap.
Users didn't have a data problem. They had a translation problem. The report was delivering information, but no meaning. Our job was to close that gap.
03
Rethinking the Information Architecture
Rethinking the Information Architecture
03
Traditional reports - list parameters in the order the lab processed them alphabetically or by test panel. That's a workflow for a pathologist, not a mental model for a patient.
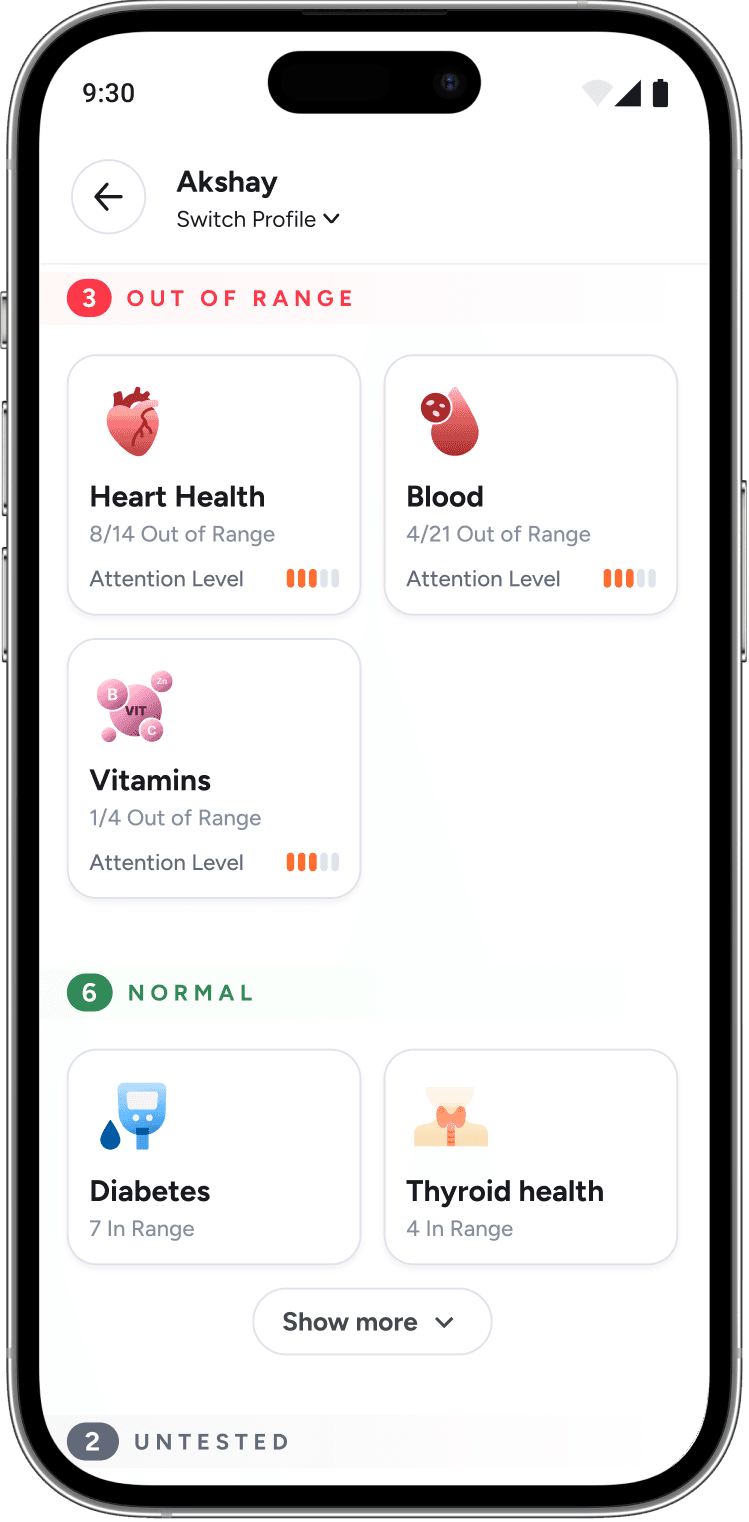
We reorganised every biomarker into body systems:
We reorganised every biomarker into body systems:

Each system becomes a card that shows how many parameters are out of range and an attention level, so users can immediately navigate to what matters to them instead of reading 40 rows linearly.
Each system becomes a card that shows how many parameters are out of range and an attention level, so users can immediately navigate to what matters to them instead of reading 40 rows linearly.



Versions we tried before go - live

04
A 5-Level Severity Scale
A 5-Level Severity Scale
04
Binary status : High / Normal / Low was the biggest source of misinterpretation.
A slightly elevated LDL reads identically to a critically elevated one.
A mildly low Vitamin D looks the same as a dangerously deficient one.
Users had no way to calibrate their response.
Binary status : High / Normal / Low was the biggest source of misinterpretation.
A slightly elevated LDL reads identically to a critically elevated one.
A mildly low Vitamin D looks the same as a dangerously deficient one.
Users had no way to calibrate their response.
We replaced the pass/fail system with a 5-level colour scale.
We replaced the pass/fail system with a 5-level colour scale.


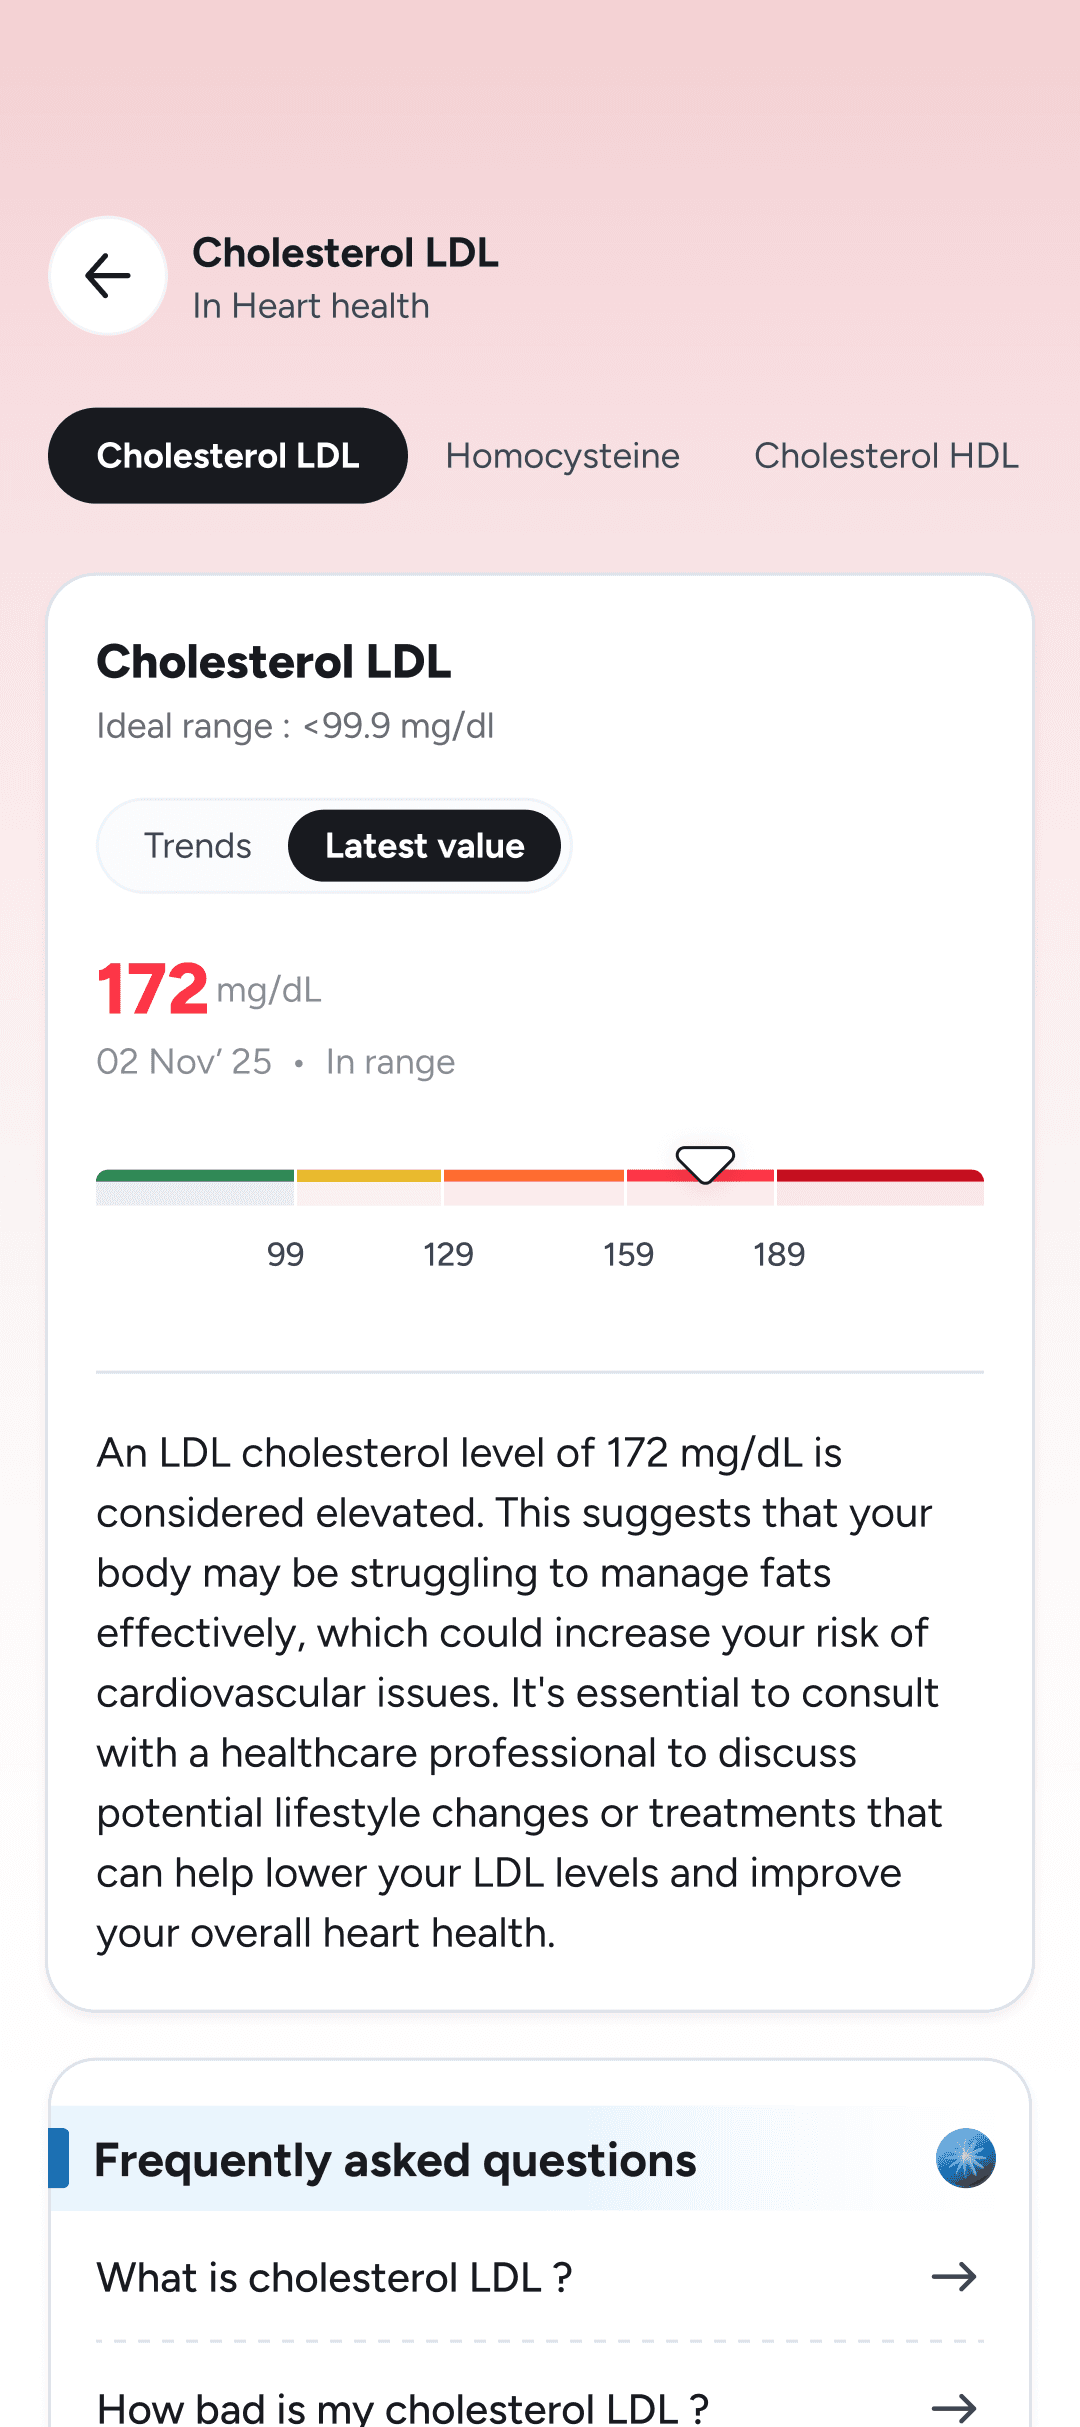

Each level maps to a clinical threshold, carries a plain-language label, and implies a clear action. Users get gradation, not just flags.
Each level maps to a clinical threshold, carries a plain-language label, and implies a clear action. Users get gradation, not just flags.
05
Making Every Value Readable
Making Every Value Readable
05
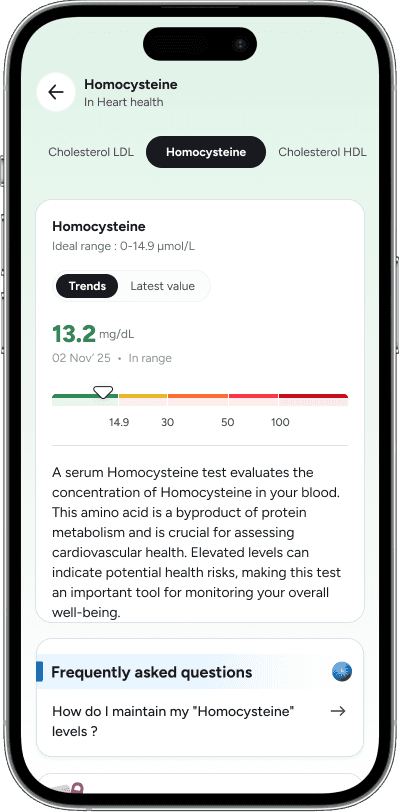
A number without context is noise. Each biomarker now has a detail page built around the three questions users actually ask not the ones a pathologist expects them to ask.
A number without context is noise. Each biomarker now has a detail page built around the three questions users actually ask not the ones a pathologist expects them to ask.


06
Spotting What's New This Time
Spotting What's New This Time
06
Even users who tested regularly had a consistent frustration: when a new report arrived, they had no idea what had actually changed since last time.
To find out, they had to open the previous PDF side by side manually scanning two walls of numbers to spot differences. Most didn't bother.
Even users who tested regularly had a consistent frustration: when a new report arrived, they had no idea what had actually changed since last time.
To find out, they had to open the previous PDF side by side manually scanning two walls of numbers to spot differences. Most didn't bother.
Every new report should answer one question before anything else: what's different from last time?
Every new report should answer one question before anything else: what's different from last time?
We added a report-level diff view that surfaces this automatically.
We added a report-level diff view that surfaces this automatically.

The diff doesn't replace the full report it sits at the top as a summary layer. Users who want the full picture can still scroll down. But for the majority who just want to know 'what do I need to focus on today', the answer is now the first thing they see.
The diff doesn't replace the full report it sits at the top as a summary layer. Users who want the full picture can still scroll down. But for the majority who just want to know 'what do I need to focus on today', the answer is now the first thing they see.
07
Making progress visible
Making progress visible
07
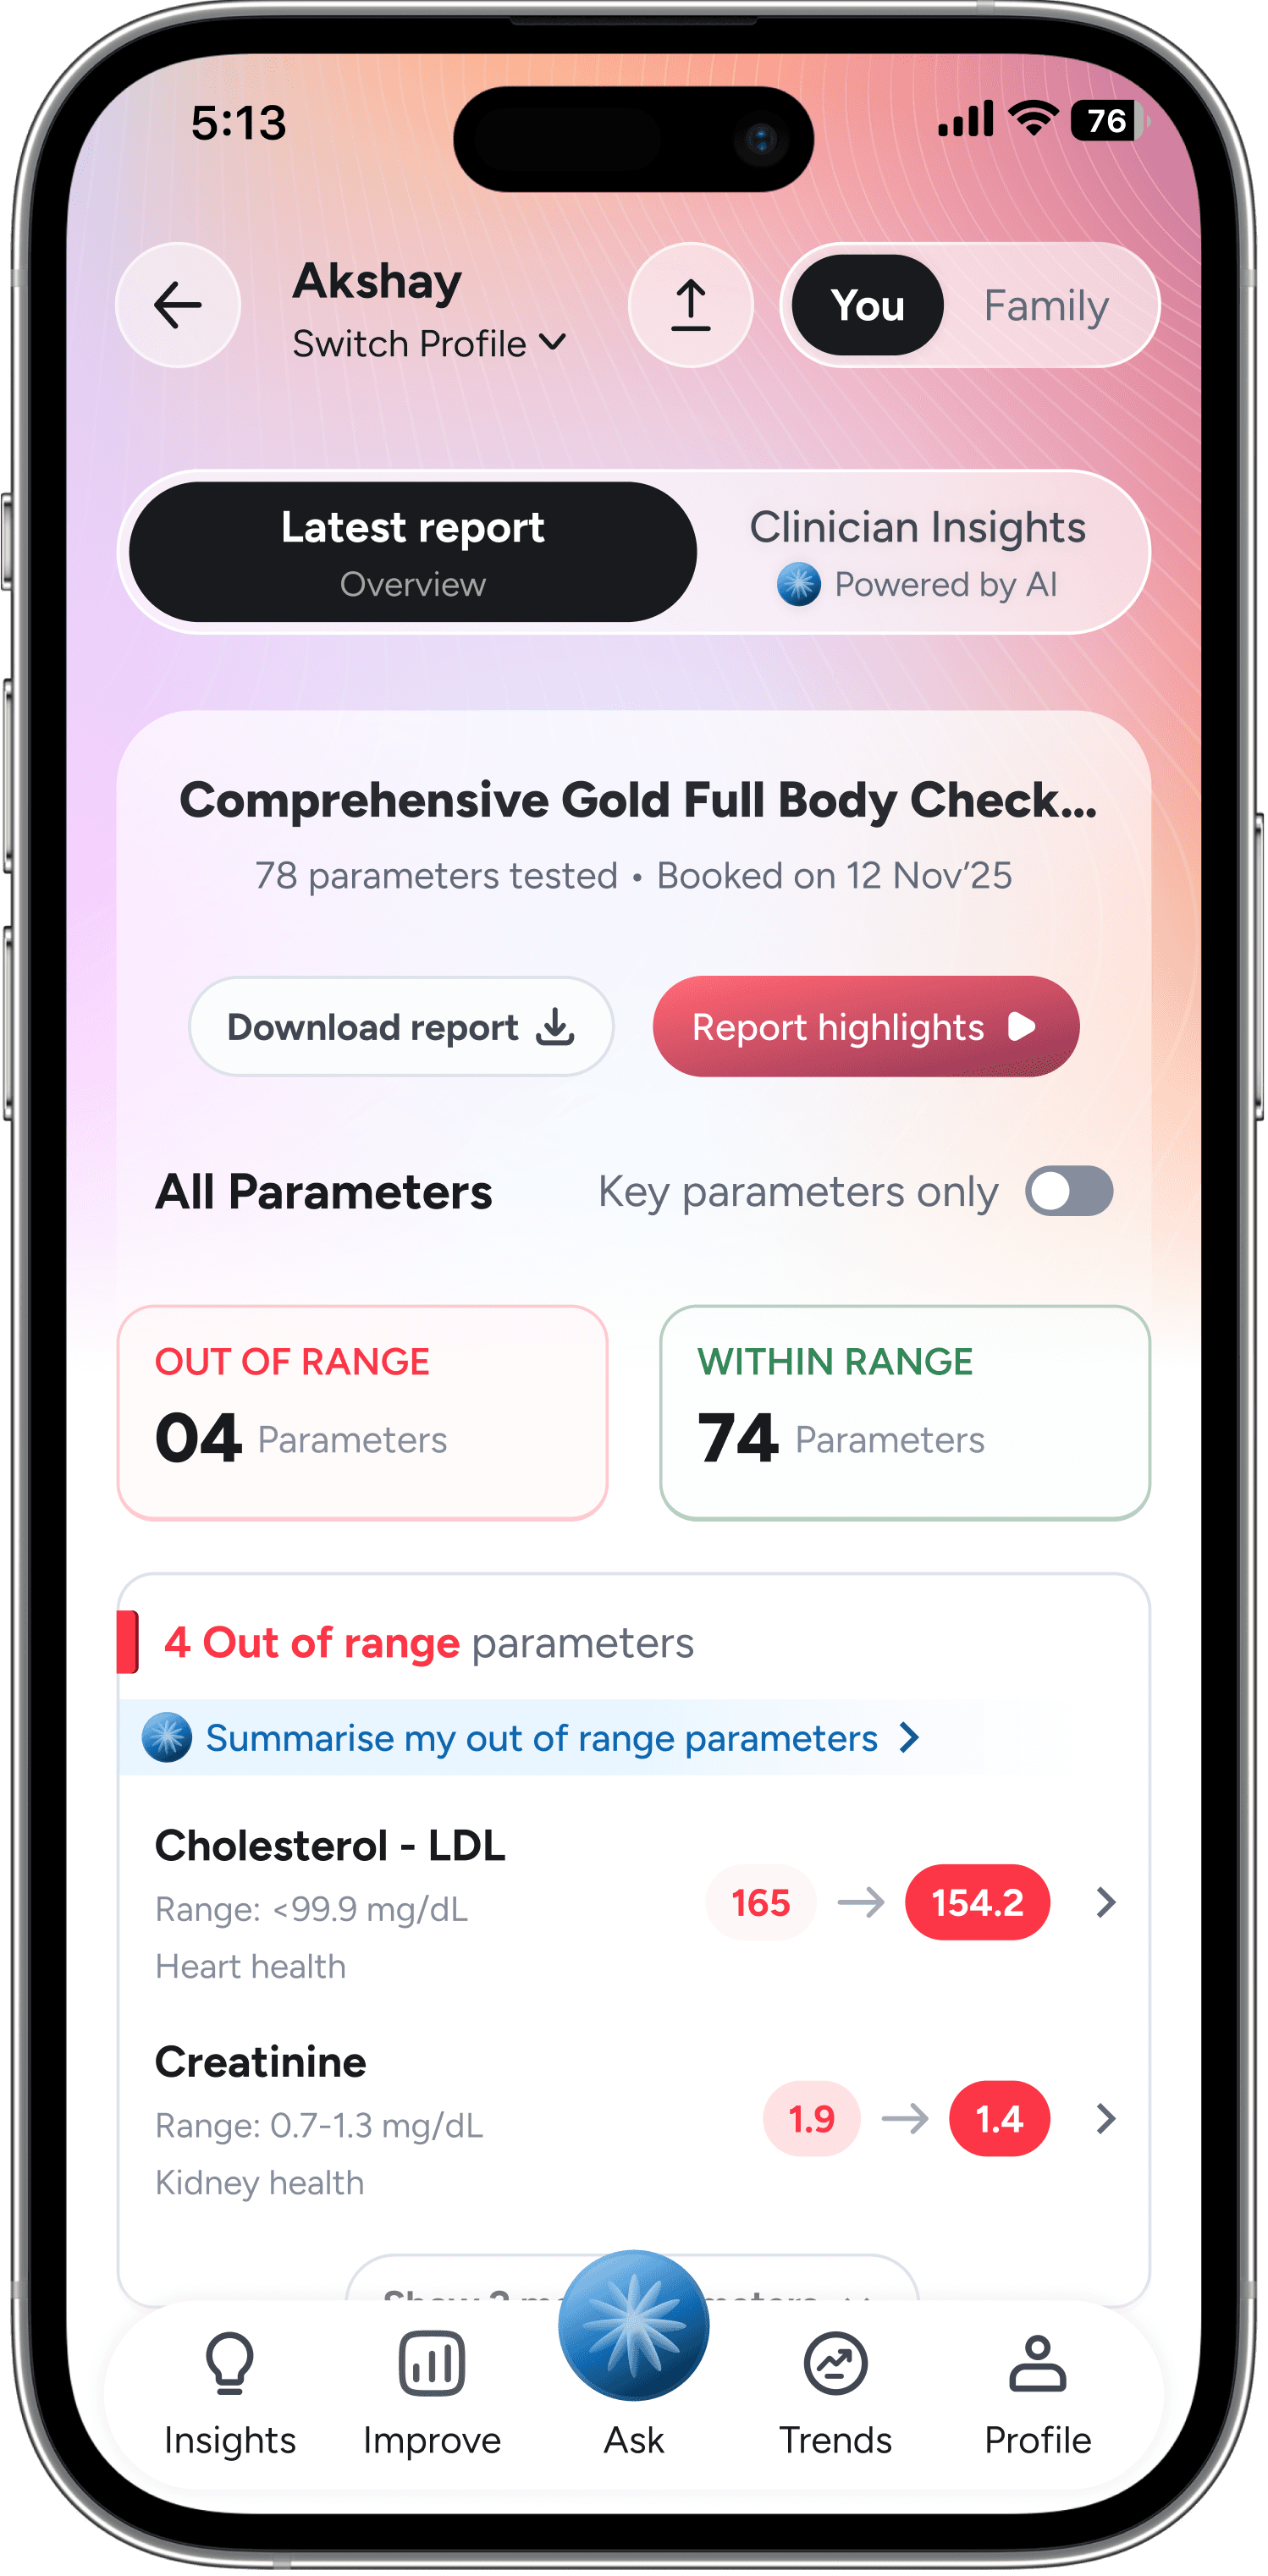
Getting a biomarker back into range is a real win. But nothing in the report ever treated it like one. A value that improved looked exactly the same as a value that was just never flagged in the first place. There was no moment that said "hey, this got better because of something you did."
That felt like a miss. People had done the work. The report should say so.
So when a parameter moves from out of range back into range between two reports, we now show it: a badge, how many markers improved, a simple before to after.
More like something you'd actually want to screenshot.
More like something you'd actually want to screenshot.


08
Impact
08
The real impact
The real impact
Users started sharing their health progress publicly. This didn't happen with the old PDF it was just a document to hand to a doctor.
Users started sharing their health progress publicly. This didn't happen with the old PDF it was just a document to hand to a doctor.


Turning health documents into insights
A unified upload experience for lab reports, prescriptions, and scans
Turning health documents into insights
A unified upload experience for lab reports, prescriptions, and scans